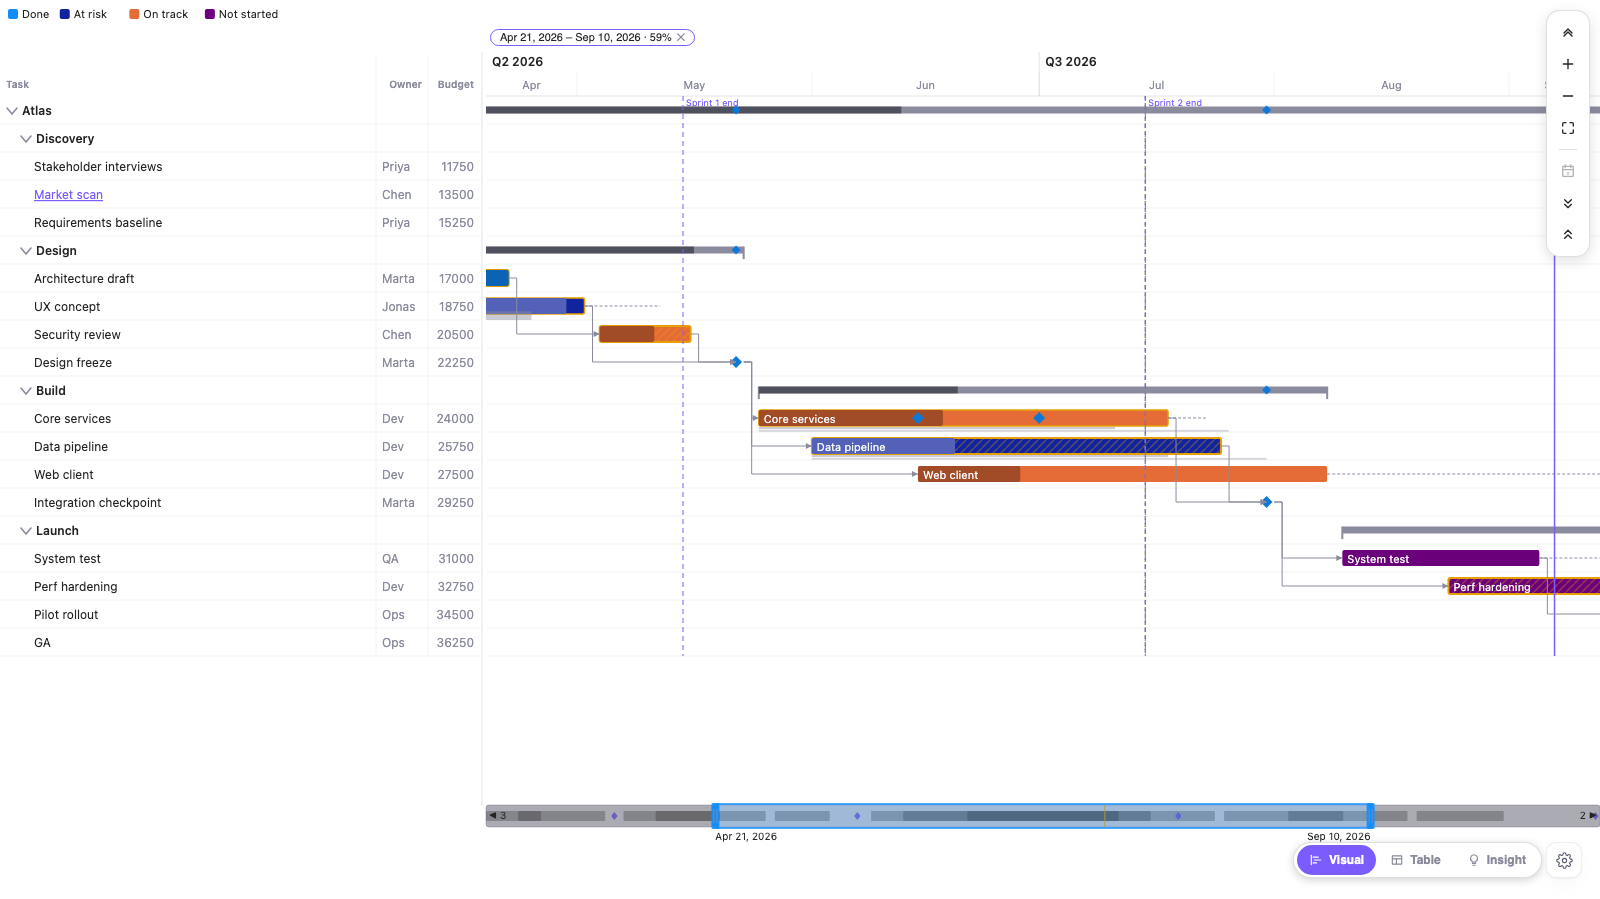
Power BI has no Gantt chart among its built-in visuals, so a project plan with dependency arrows and a critical path needs a visual from AppSource (Microsoft's store for add-ons). Most of the work, though, is in the data: if the predecessors are modelled cleanly, any Gantt visual that supports dependencies can draw them. This post covers the data side first, then how the critical path is worked out, using the way I built it in Zentrix Advanced Gantt as the concrete example.
The columns you need
At minimum, one row per task with:
| Column | Example | Notes |
|---|---|---|
| Task ID | 12 | Stable and unique. A number or short code, not the task name. |
| Task name | Data pipeline | What people read. |
| Start | 2026-03-02 | A date column. |
| End | 2026-03-20 | Or a duration, if the visual accepts one. |
| Predecessors | 8FS+2d, 9SS | The IDs this task depends on, with link type and lag. |
A parent or phase column for the hierarchy is optional but almost always worth having. The predecessor column is the one people get wrong, so the rest of this section is about that.
The predecessor notation
The convention most project tools use, and the one I read in Advanced Gantt, is a comma-separated list where each entry is an ID, an optional link type and an optional lag:
7means "finish-to-start from task 7, no lag". A bare ID is finish-to-start.12FS+2dmeans task 12 must finish, then wait two days, before this one starts.14SSmeans this task can start once task 14 has started.5FF-1dis a negative lag (a lead): this task finishes one day before task 5 finishes.
In our visual, entries can be separated by commas or semicolons, the d is optional, and lag can be a decimal. Each reference is matched to a task by Task ID first (when you've bound a Task ID field), then by exact task name, then by row number, which is how Microsoft Project numbers rows. References that don't match anything, or that point at the task itself, are skipped and counted rather than guessed at.
My advice is to always bind a Task ID. Matching by name breaks the day two tasks are both called "Testing", and matching by row number breaks as soon as someone sorts the source table.
The four link types
| Type | Reads as | Typical use |
|---|---|---|
| FS, finish-to-start | B starts after A finishes | Most dependencies. Build, then test. |
| SS, start-to-start | B starts after A starts | Work that runs in parallel once kicked off. |
| FF, finish-to-finish | B finishes after A finishes | Documentation that can't close before the build does. |
| SF, start-to-finish | B finishes after A starts | Rare. Handovers, like an old system running until the new one starts. |
How the critical path is calculated
The critical path is the chain of tasks that sets the end date. Each task has a total float (Microsoft Project calls it total slack): how long it can slip without moving the finish. Microsoft's Project docs describe total slack as the smaller of late finish minus early finish and late start minus early start, and Project marks a task critical when its total slack is at or below a threshold that defaults to 0 days.
The standard way to get there is the critical path method:
- Forward pass. Walk the tasks in dependency order and work out each one's earliest start and earliest finish, given its predecessors, link types and lag.
- Backward pass. Start from the end and work out each task's latest start and latest finish that still hits the end date.
- Float is the gap between the two. Zero or less means critical.
Each link type turns into a slightly different constraint. With a predecessor A, a successor B and a lag L, finish-to-start says B's earliest start is at least A's earliest finish plus L. Start-to-start compares the two starts. Finish-to-finish and start-to-finish constrain B's finish, so they're converted to a start by subtracting B's duration.
Three details that change the answer
Separate projects in one dataset. If your table holds two programmes that don't link to each other, a single backward pass from the overall end date makes the shorter programme look like it has a lot of float, and only the longer one gets a critical path. Advanced Gantt anchors the backward pass separately for each group of linked tasks, so each programme gets its own critical chain, which is how Microsoft Project treats separate projects.
Tasks with no links. A task with no predecessors and no successors is its own tiny "project", so by the maths it's always critical. That's noise, so I leave unlinked tasks out of the critical-path result entirely. They draw normally, they just aren't marked critical and show no float.
Calendar days versus working days. The calculation inside our visual counts calendar days. If your float has to respect weekends and holidays, compute criticality in your scheduling tool or your model and pass it in as a flag (next section).
Model-driven flag or computed in the visual?
Advanced Gantt has an Is critical field you can bind, and a setting for where criticality comes from. If you bind the flag and pick it as the source, the visual uses your values as-is. Otherwise it runs the calculation above on the rows it receives.
I'd use the flag when:
- the plan comes from Microsoft Project or a similar tool that already has a Critical field, so Power BI and the scheduler agree;
- the report uses row-level security (rules that show each viewer only some rows). A visual can only calculate from the rows it can see, so a viewer with a filtered subset would get a different critical path from someone who sees everything;
- weekends and holidays matter for your float.
The computed path is the right choice when the data is a simple task list with predecessors and nothing upstream does the scheduling.
Showing it without relying on colour
Red bars are the traditional way to show the critical path, but colour alone fails for colour-blind readers and in high-contrast mode. In Advanced Gantt the critical tasks are hatched as well as coloured, and the float is available per task in the tooltip and the detail panel. Whatever visual you use, check the critical path is still readable in a greyscale PDF export.
Where this is in the visual
In Zentrix Advanced Gantt, dependency arrows in all four link types with lead and lag are in the free tier. The computed critical path and float are part of the paid plan in the Power BI Service. In Power BI Desktop everything is unlocked, so you can try both on your own plan before deciding. If you're also dealing with summary rows and baselines, I wrote about parent rollups and baselines separately.