Zentrix Sankey Pro
Understand how customers, money and materials move — and find the paths, losses and changes that matter.
A flow-analysis Sankey for Power BI that stays readable with real enterprise data. Build a journey straight from stage columns with no source/destination model, trace how much of one node’s volume rides each ribbon, tame clutter with ranking, thresholds and automatic “Other” grouping, compare actual vs budget or period-over-period, and reconcile every node’s inflow against its outflow — with a deterministic insight engine that names the drop-offs, concentration and anomalies, entirely inside the Power BI sandbox.
- Data roles
- 11 — source + destination, or journey stages, plus a value
- Input modes
- 2 — source → destination, or multi-stage journey columns
- Settings
- 9 gear tabs · 27 panels · 157 properties
- Views
- Flow diagram, node metrics table, plain-English insights
- Scale
- 200 nodes / 1,000 flows free · uncapped on a paid seat
- Pricing
- Free forever in Desktop · from $1.49/user/month in the Service
- Accessibility
- Keyboard nav, focus ring, SR summary, CVD-safe, high contrast
- Privacy
- No external calls, no telemetry
See it in action
A quick look at the
Sankey Pro
How to read your funnel as a Sankey in Power BI (6 things to look at)
Features
Built to surface
what matters
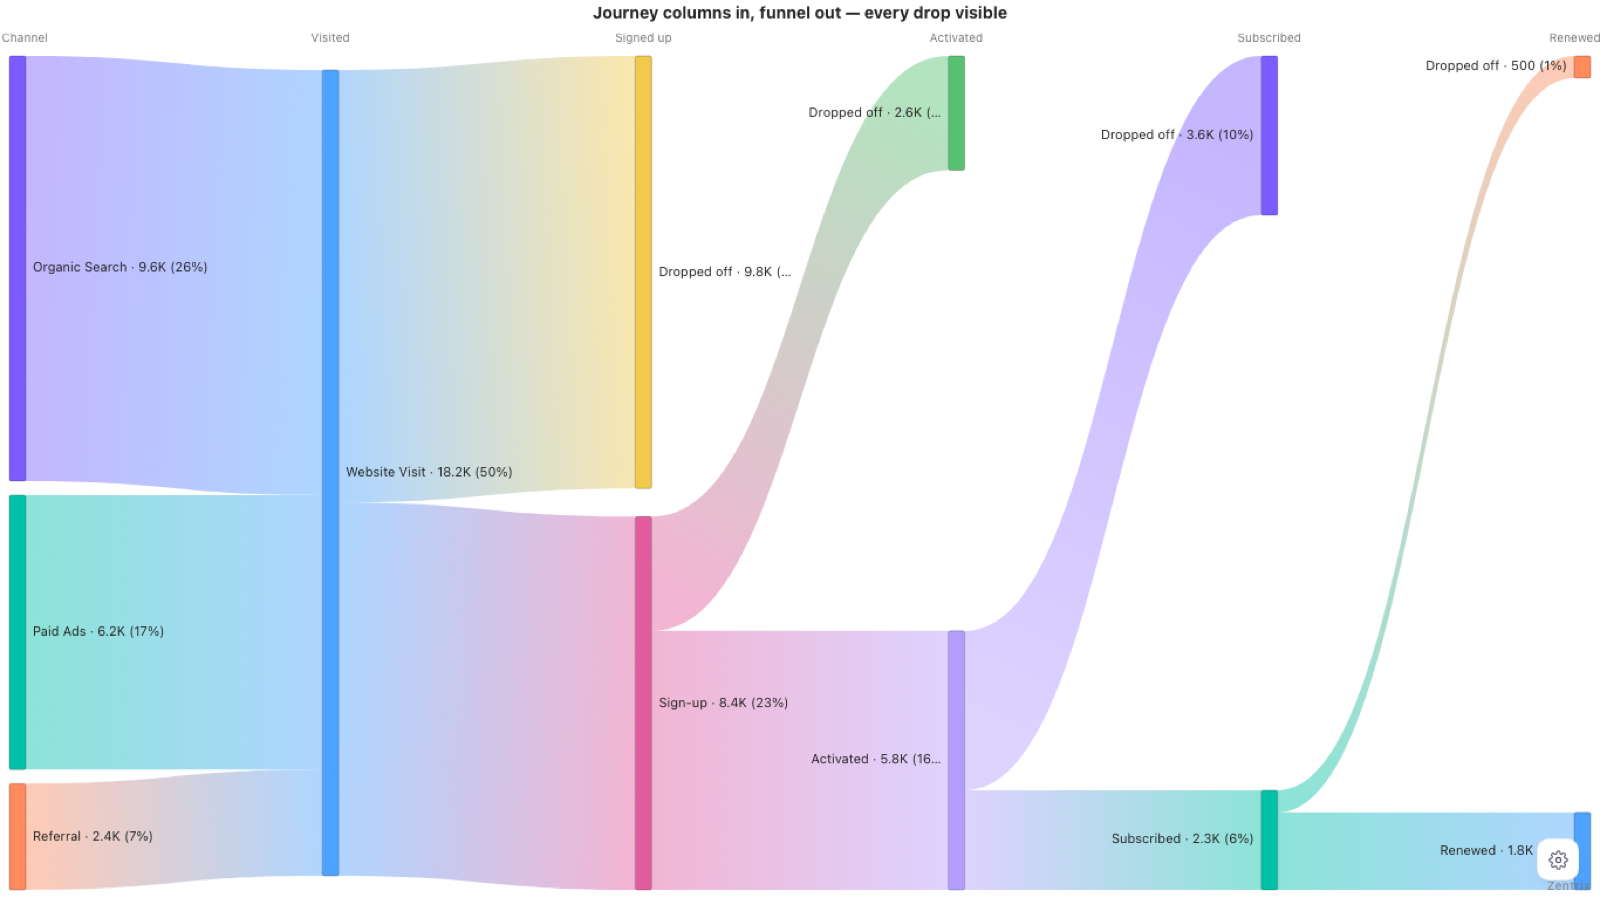
Automatic Journey Builder
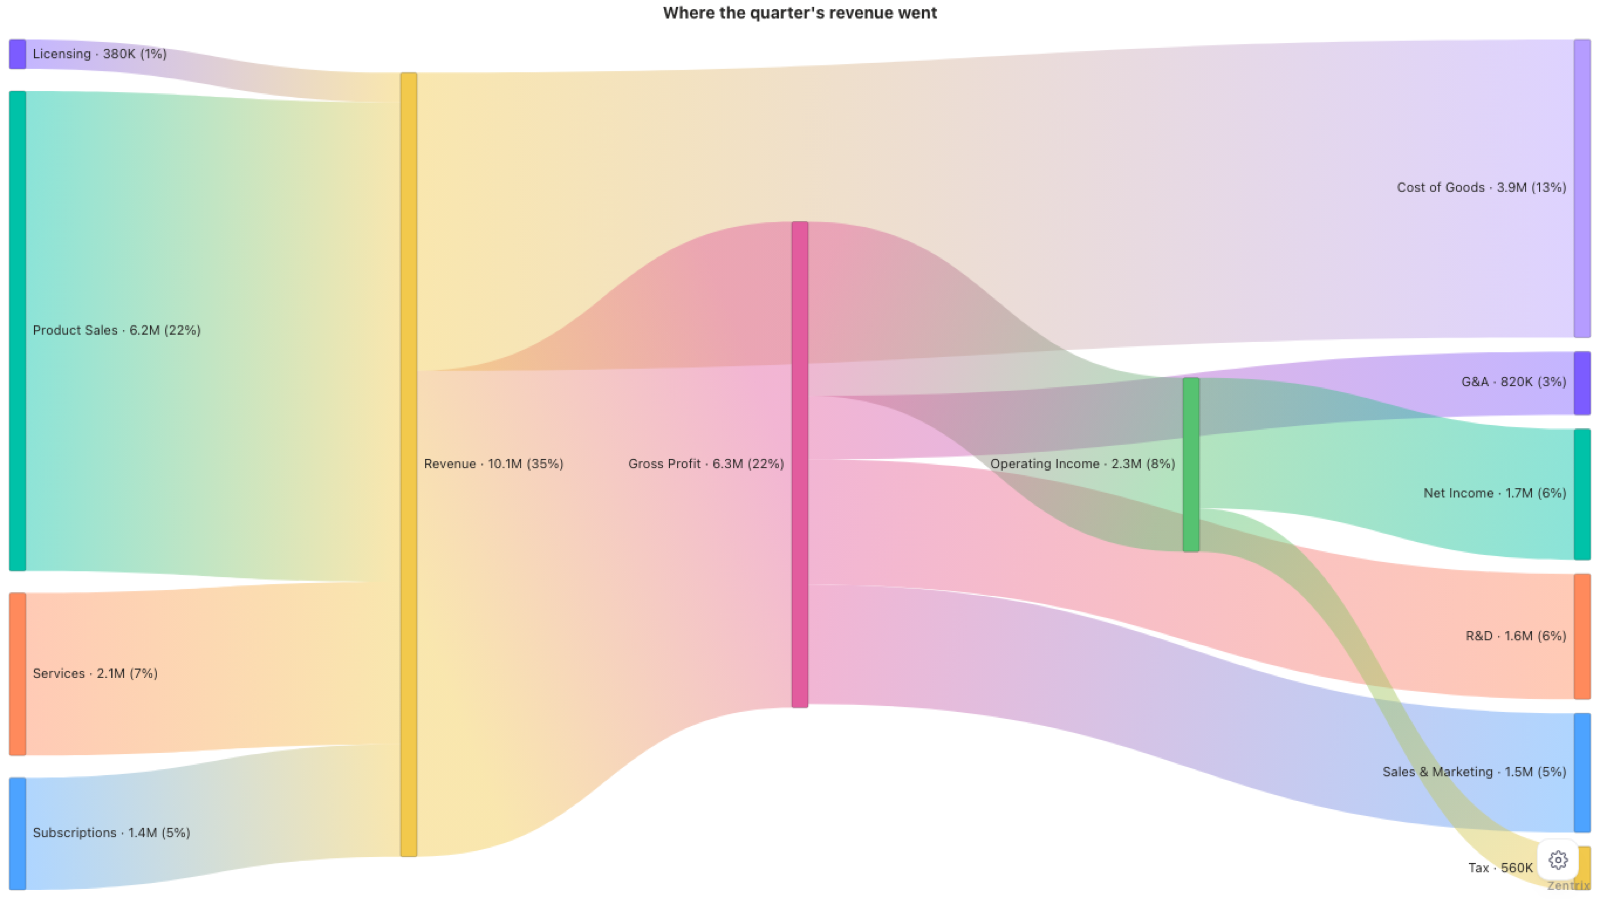
Drag Stage 1 → Stage 2 → Stage 3 straight from your table — no calculated source/destination model required. Or bind source, destination and a value the classic way. Either binding builds the same diagram, and cycles, self-links and skipped stages are first-class rather than errors.
Follow one flow through the whole diagram
Free + PaidHover to light up what connects — connected only, the incoming path, the outgoing path, or the full path end to end — all free. Trace flow goes further and draws how MUCH of the hovered node’s volume rides each ribbon, and says out loud where several inflows mix and the split can only be estimated. Click any node for a docked panel with its full breakdown and its top sources and outcomes.
Clutter control that never lies
Rank nodes Top-N or Bottom-N across the diagram or within each stage, roll the rest into an “Other” bucket, cut by value or by share, keep the connecting nodes that hold surviving paths together, and pin or drop any individual node by hand. Whatever is removed is always counted on the diagnostics line — never dropped silently, never frozen.
Compare mode
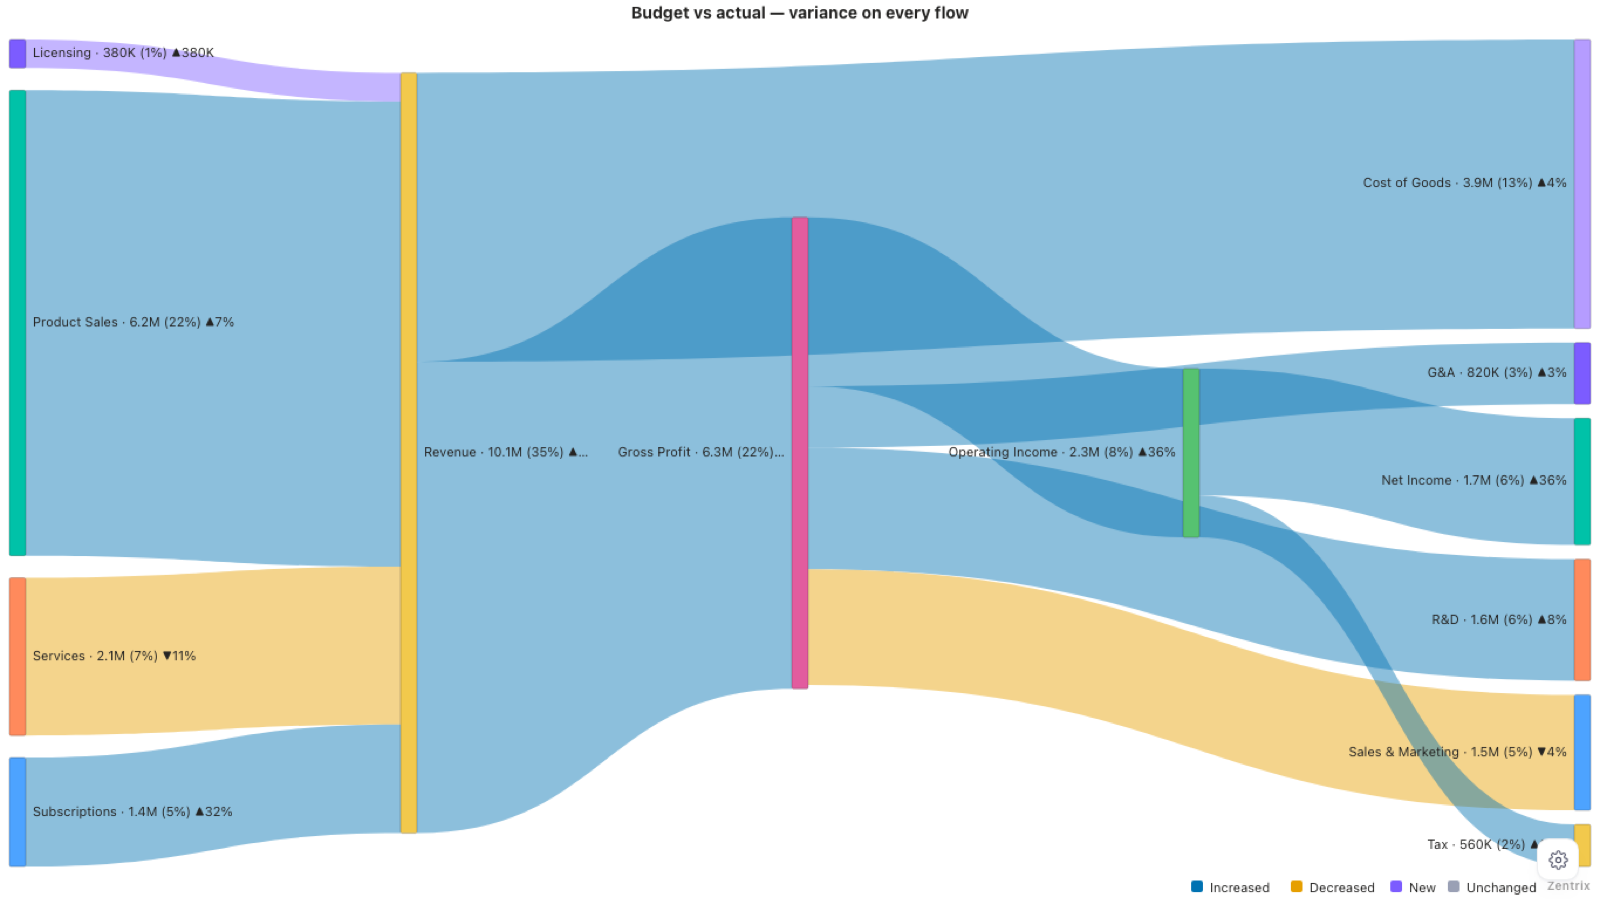
PaidBind a second measure — last month, budget, scenario B — and every flow gains a delta and a status: new, up, down, flat, disappeared. Colour the ribbons by variance, write the change into the labels as an amount or a percentage, and let the insight engine name the fastest riser and the steepest decline.
Flow Integrity Check
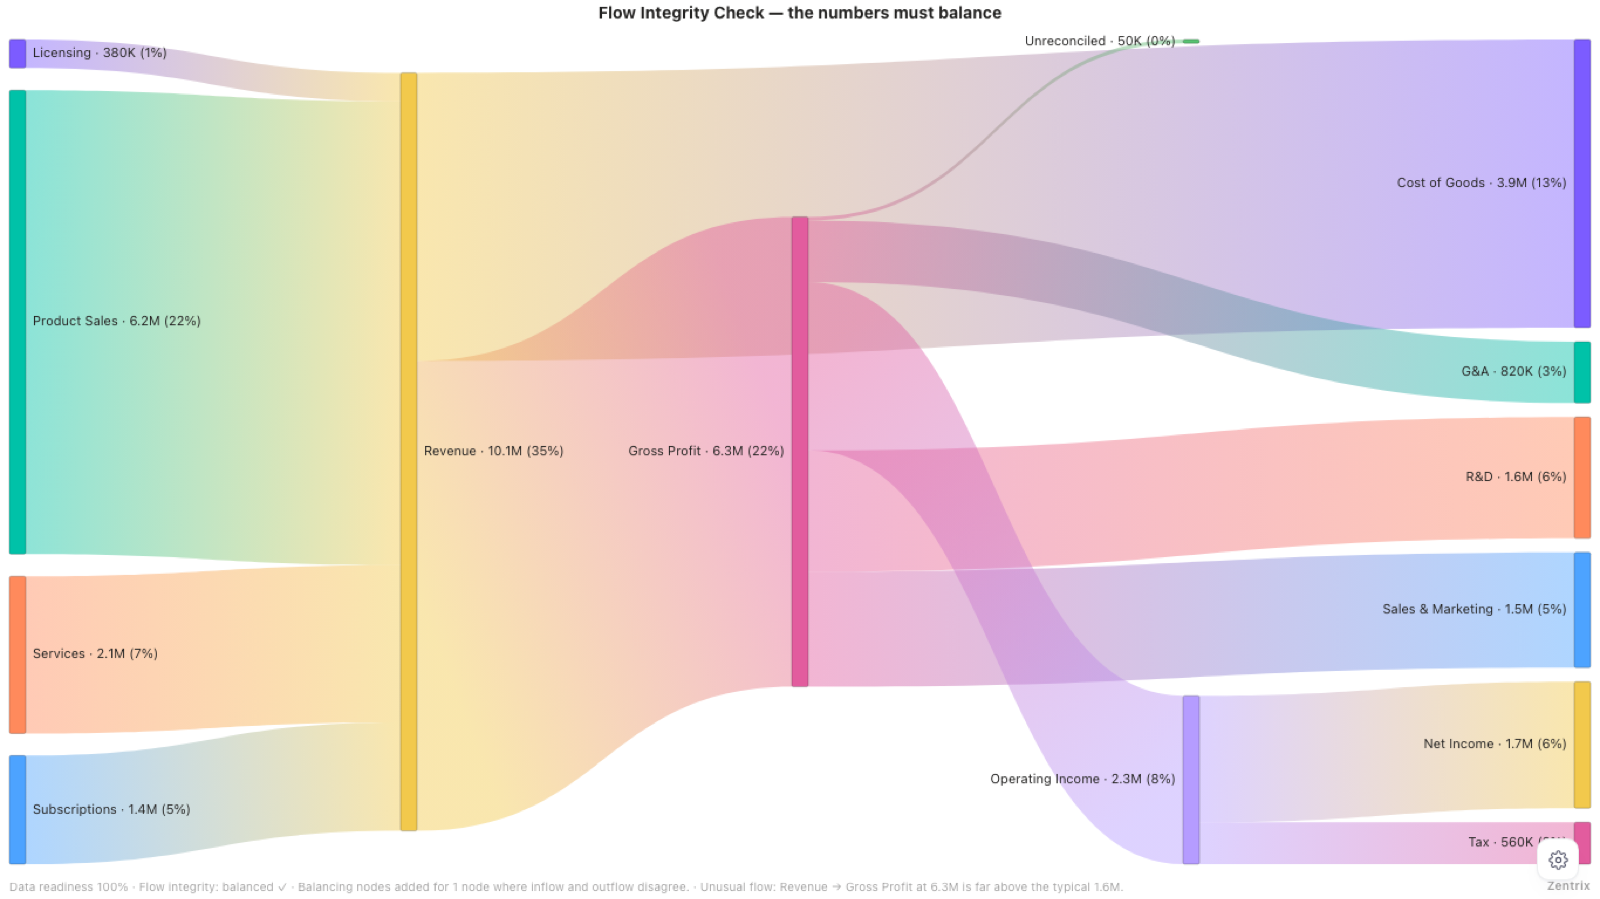
PaidFor data that is supposed to balance — money, headcount, inventory, energy. It reconciles every node’s inflow against its outflow within a tolerance you set, names the worst offender, and can draw the unexplained gap as a balancing node on the diagram. Nothing is invented and nothing is rescaled; the difference is simply drawn.
Built-in insight engine
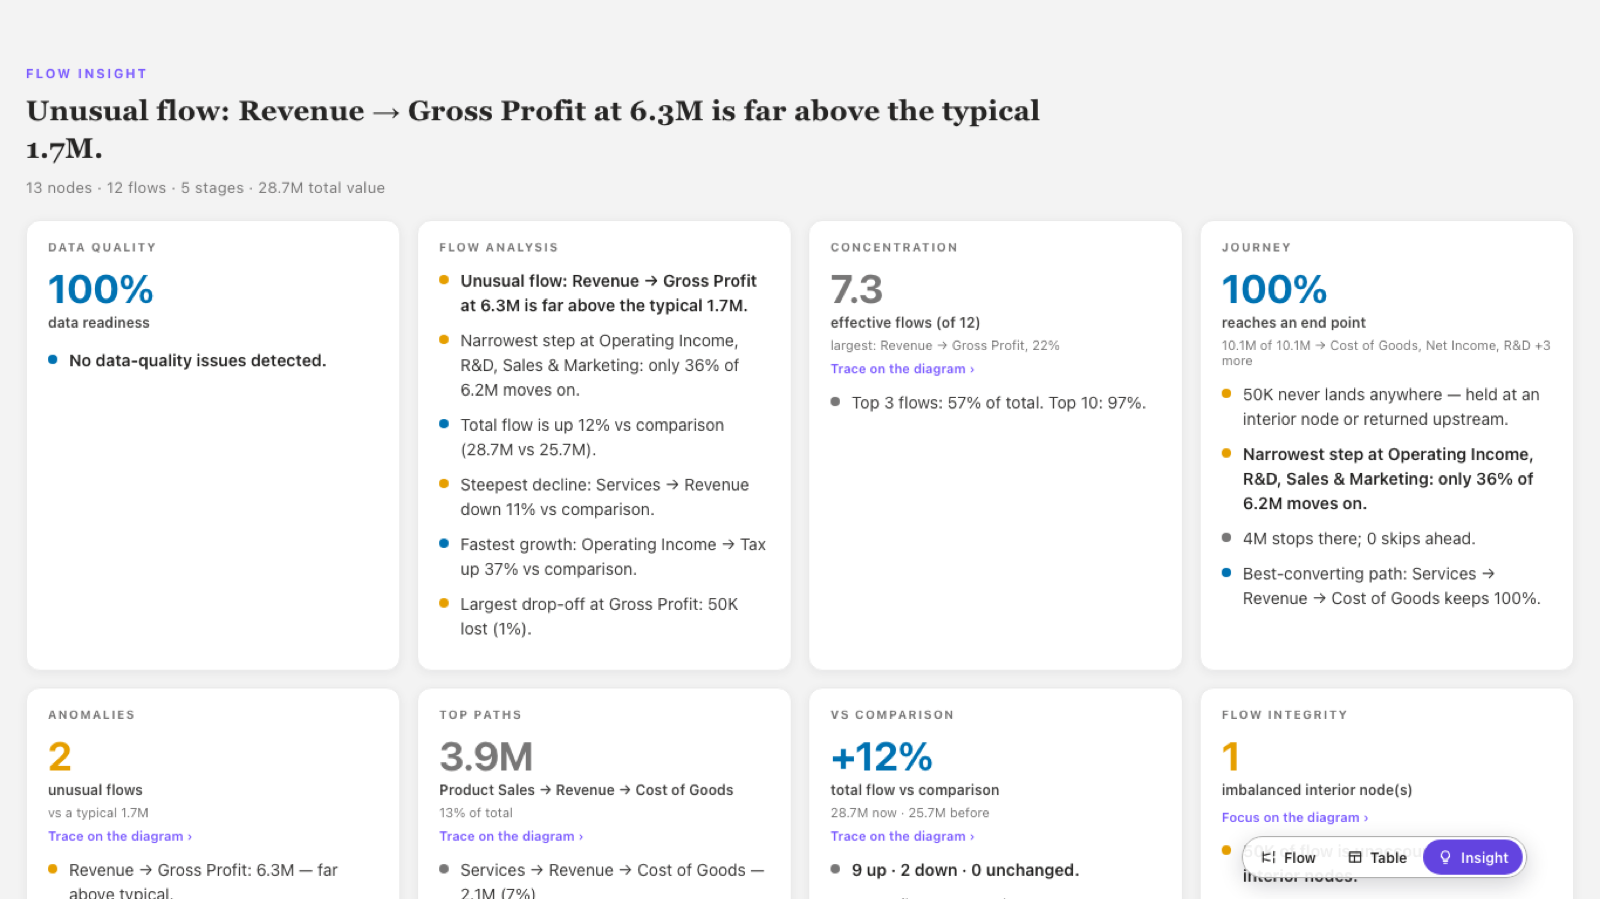
PaidA plain-English read-out that names the largest paths, the biggest drop-off, the bottleneck a lot of volume squeezes through, the flows that are unusually large for this data, and how far the volume is concentrated. Findings are clickable — trace the path it just named, or focus the node it just called out.
Settings inside the visual
Nine tabs, 27 panels and 157 properties in a floating gear on the canvas rather than buried in the format pane, with search that speaks Power BI’s own vocabulary. 35 palettes, 20 node textures, 103 semantic icons, per-node images, and a rules editor for conditional formatting on nodes and flows. Quick actions cover sweep select, zoom, fit, undo/redo, focus mode and export.
Three views of the same flow
Free + PaidThe diagram itself and a sortable node-metrics table — value, inflow, outflow, stage, share of total — with search and CSV export. The plain-English read-out is the third view. Same numbers in all three, so the table and the story never disagree.
Built for real reports
Cross-filters the rest of your report on click, sweep-select a region, keyboard navigation across and along stages with a visible focus ring, a screen-reader summary and a table mirror of every flow that is always in the page. Colour-vision-safe palettes and node textures so colour is never the only cue, plus high-contrast support. Beyond the free cap it says it is showing N of M rather than freezing.
Screenshots
The real thing,
not a mock-up
Every image below is a capture of the shipping Sankey Pro. Where a shot needs a paid plan, its caption says so.
Learn every setting
Know every setting
before you open Power BI
The Insight Engine
PaidInsights that never
leave your tenant
The Sankey Pro computes its insights with transparent, deterministic logic — entirely inside the Power BI sandbox. No external calls, no telemetry, nothing leaves your tenant. The read-out itself is a Paid capability; the privacy promise below holds at every tier, free included.
- Largest paths and dominant contributors
- Biggest drop-offs and bottleneck transitions
- Flows that are unusually large for this data
- Flow concentration, imbalance and rework loops
- Fastest-growing and steepest-declining flows vs a comparison
Runs in the Power BI sandbox
Every insight is computed inside the Power BI visual sandbox. The visual makes no external network calls and sends no telemetry — nothing about your data leaves your tenant.
Deterministic by design
Stage assignment, node ordering and link routing are pure functions of your data, seeded from stable keys — no random number, no wall clock, and text widths computed rather than measured. The same data lays out identically on every refresh and on every machine.
Reads the flow for you
Beyond drawing the diagram, the Insight view names the largest paths, the biggest drop-off, the bottleneck and the flows that are unusually large for this data — in plain sentences, with each finding clickable to trace it. It is a paid capability; the privacy promise above holds on the free tier too.
Free and paid
What's free,
and what isn't
Power BI Desktop is free and fully unlocked — every feature, every cap lifted, no watermark, forever. You can build an entire production report without being asked for money. A licence starts when that report is used in the Power BI Service, and there everyone who opens it needs a seat, author and reader alike. Both paid plans unlock the identical feature set; they differ only in the per-seat rate.
Free forever — and unlimited in Desktop
200 nodes · 1,000 flows in the Service
A complete, publishable Sankey. In Power BI Desktop nothing is capped at all — every feature below and every paid one too, with no watermark and no sign-in.
- Both input modes — source → destination and the Automatic Journey Builder
- Four orientations, five alignments, six node-ordering modes, flow ordering
- 35 palettes, 20 node textures, and one icon or image on every node
- Node labels with collision handling, stage titles, tooltips, category legend
- Ranking, thresholds, “Other” grouping, per-node keep/drop and the render cap
- Cross-filter, sweep select, zoom, undo/redo, the metrics table, PDF export
$1.90/user/month or $19.90/user/year
Uncapped nodes and flows
The whole visual in the Power BI Service. One paid tier — nothing is held back for a higher plan. One month free, run by Microsoft.
- Uncapped nodes and flows
- Compare mode — per-flow variance in colour, in labels and in the insights
- Flow Integrity Check with a tolerance and an optional balancing node
- The plain-English Insight view and the docked node detail panel
- Rules — conditional formatting on nodes and flows, numeric or text
- Trace flow, drop-off view, link labels, label-part ordering, animated flow
- Per-stage / per-category / per-node icons, images and textures
- Node drag saved with the report, annotations, CSV and Excel export
$1.49/user/month or $14.90/user/year
Uncapped nodes and flows
Exactly the same product at 501 seats and up — the identical feature set at a 25% lower per-seat rate. Not a bigger tier, a bigger band.
- Everything in Pro, feature for feature — there is nothing extra to unlock
- A 25% volume rate from the 501st seat
- Sold and billed by Microsoft against your Power BI account
- One-month free trial, run by Microsoft
Everyone who opens the report needs a seat
Sankey Pro is licensed per person in the Power BI Service — readers included, which is different from the Network Graph. Seats are assigned to named users in your Microsoft 365 admin centre, so you buy them only for the people who actually open a report containing the visual, not for everyone employed. Building in Power BI Desktop stays free and fully unlocked, plans are sold and billed by Microsoft, and Microsoft runs a one-month free trial on both of them.
Start free
Start free, and stay free if that's enough
The free tier of the Sankey Pro is permanent, not a trial — no watermark, no sign-in, no clock running down. Add it from AppSource, drop it on your canvas, and you're running. Everything is unlocked in Power BI Desktop; a licence applies once the report is used in the Power BI Service.
Read the Sankey Pro field guideThe free tier is staying free. If the Sankey Pro earned its place on your report, you can support the work: