Zentrix Advanced Gantt
The Gantt Power BI should have shipped.
A Gantt chart for real project schedules, not toy demos. Unlimited hierarchy depth with WBS numbering, sorting that actually works, parent bars that roll up correctly, and five thousand tasks that render without collapsing. Milestones sit as diamonds on the bar, baselines ghost underneath, dependency arrows route around rows, and a deterministic engine calls out what has slipped — all computed inside the Power BI sandbox.
- Data roles
- 30 — Task, Start and End required; the rest optional
- Scale
- 5,000 tasks with virtualised rows and a sticky task column
- Zoom
- Day, week, month, quarter, year + auto-fit
- Baselines
- Up to 3, ghosted or side by side
- Accessibility
- Keyboard nav, focus ring, show-as-table, high contrast
- Privacy
- No external calls, no telemetry
Features
Built to surface
what matters
Hierarchy that holds up
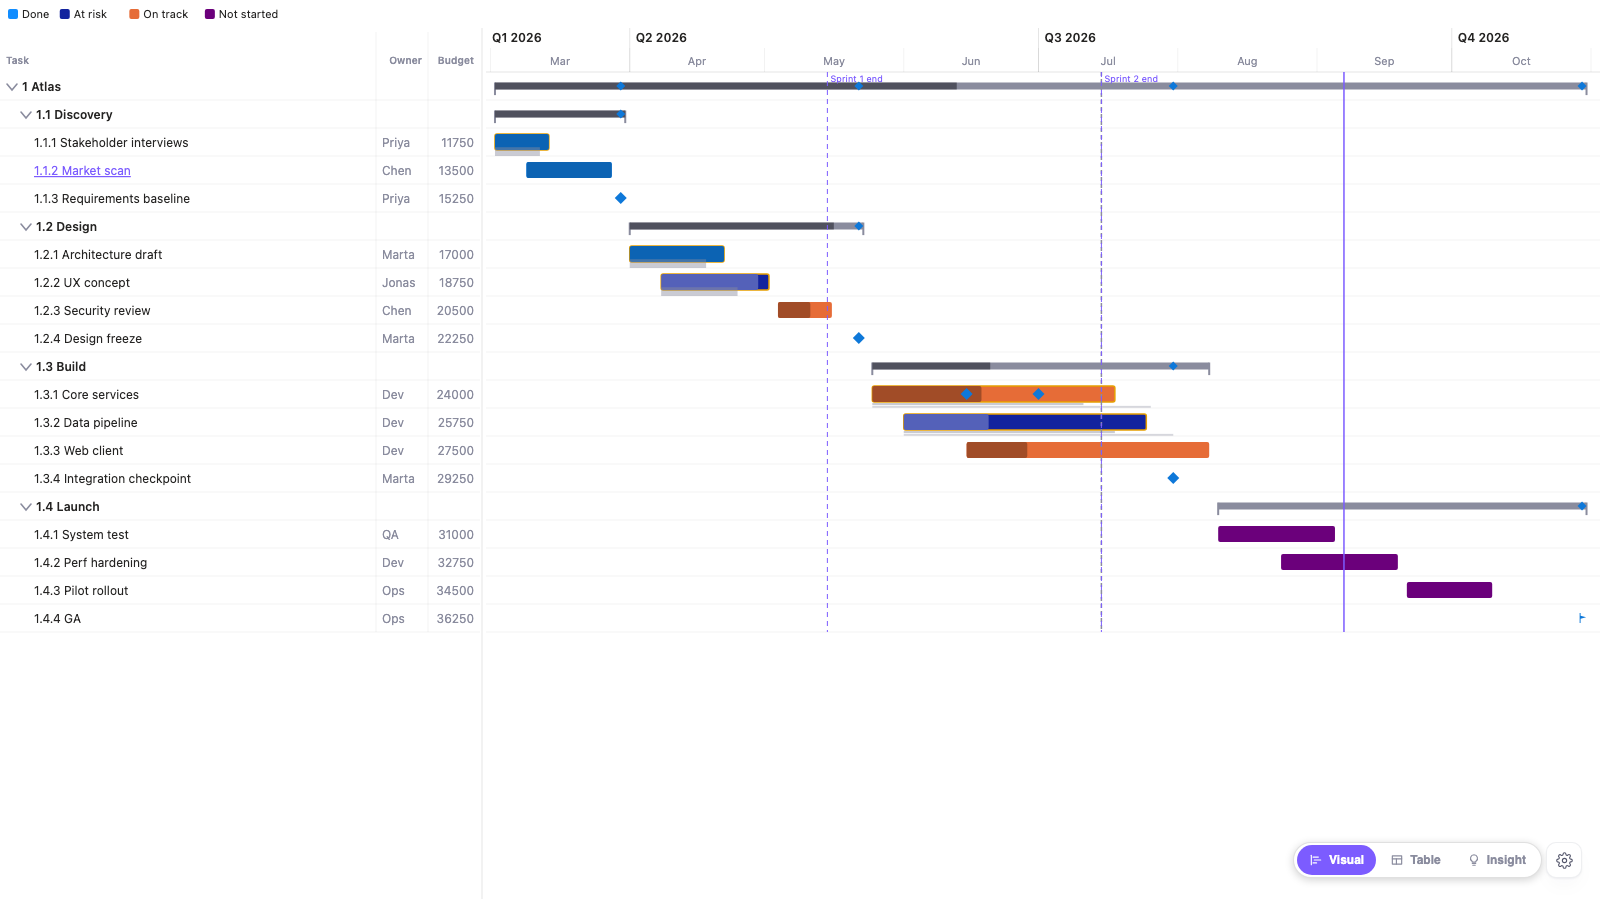
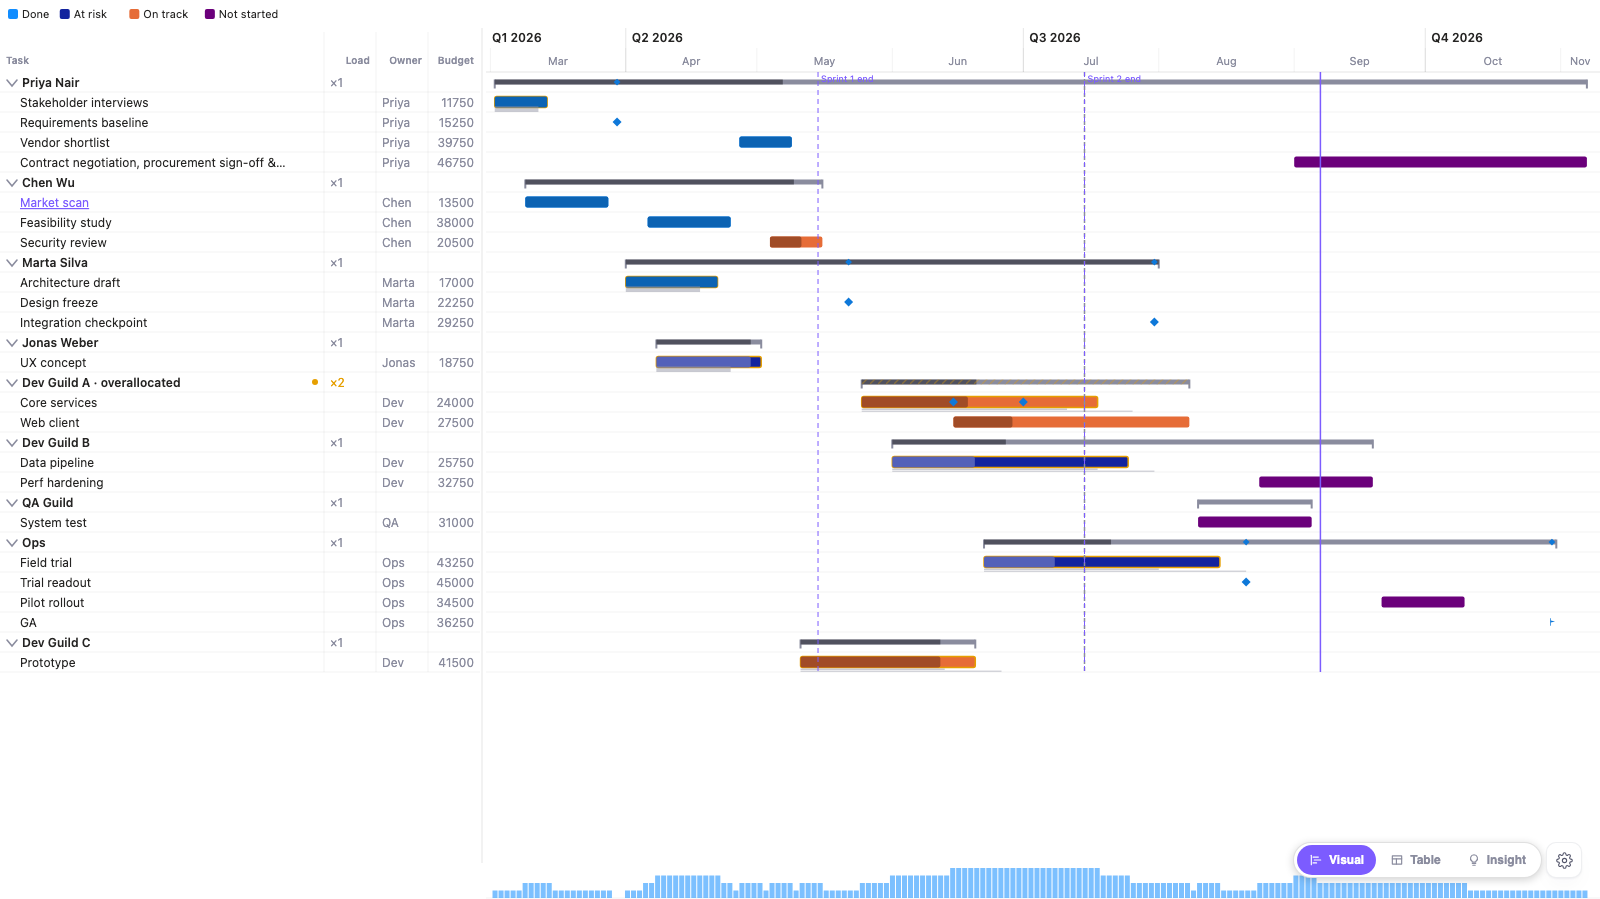
Unlimited depth from a multi-field parent path, with WBS numbering, chevron expand/collapse and expand-to-level. Parent bars are a true envelope of their children, and parent progress is duration-weighted rather than a plain average — so a summary row stops lying about where the project actually is.
Sorting that actually works
Start date, alphabetical, a custom sort-order field, or hierarchy order — with parent-level and task-level sort set independently, and the model's own “Sort by column” respected. It behaves identically in Desktop and the Service, which is the single most common complaint about the Gantt people use today.
A timeline you can read
A two-tier header at every zoom — quarters over months, months over weeks — with locale-aware formats and an ISO work-week option. Day through year presets plus auto-fit on first render, Ctrl-wheel zoom at the cursor, weekend and holiday shading, a today line and a separate data-date line.
Baselines and variance
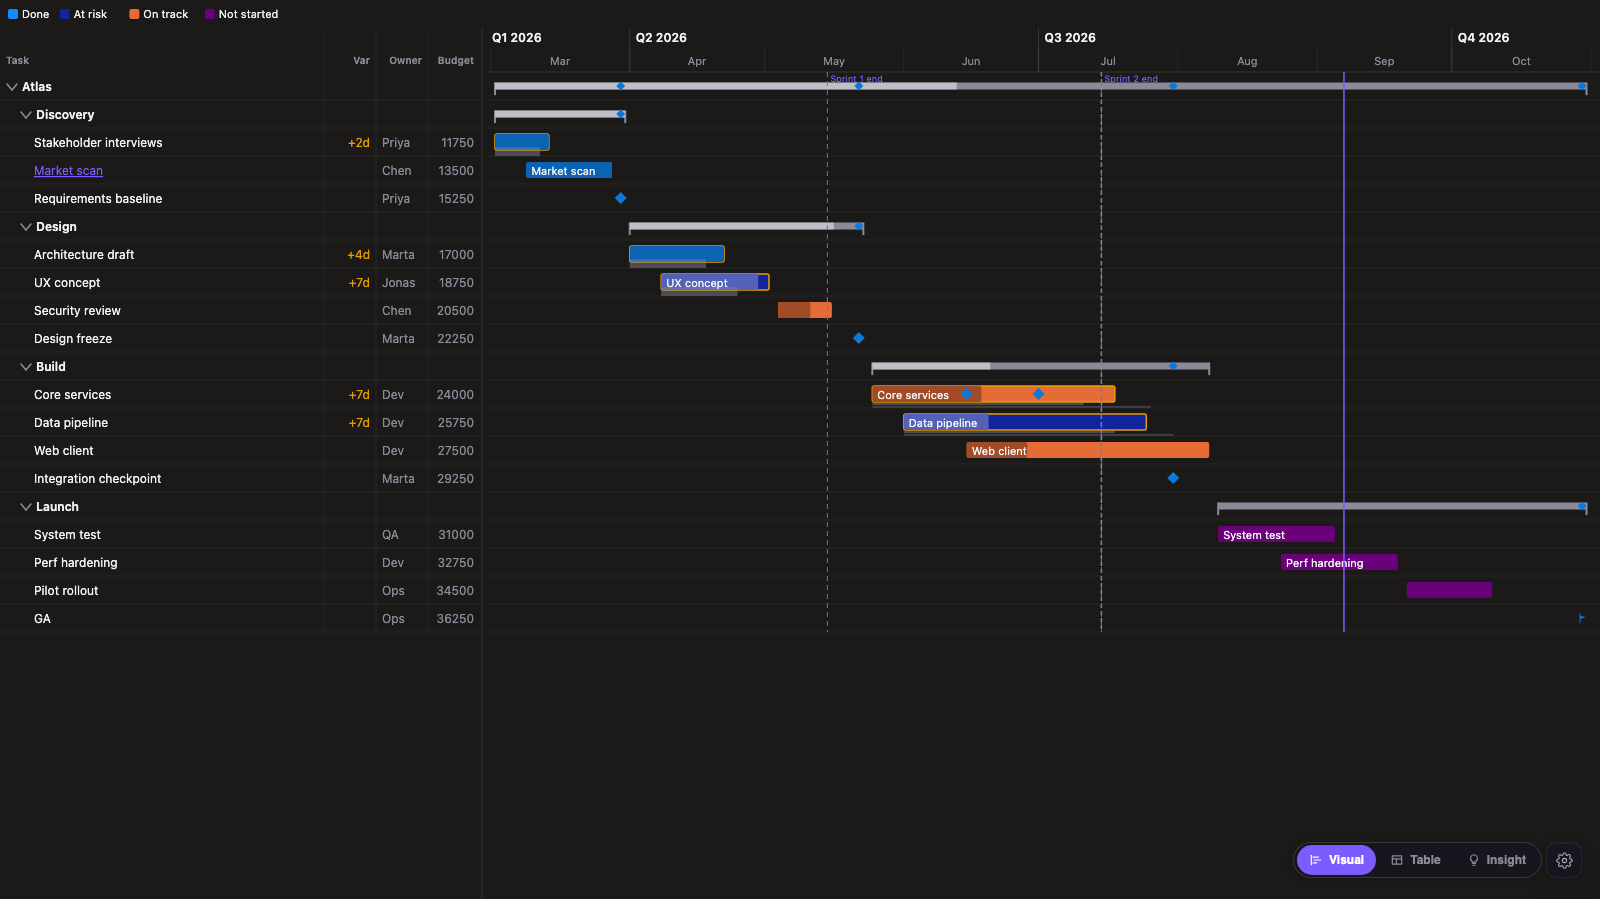
Up to three baselines drawn as ghost bars below the current schedule, or side by side, with a primary-baseline selector. Slipped bars colour one way and early bars the other, and the variance in days is available in the grid and the detail panel.
Dependencies & critical path
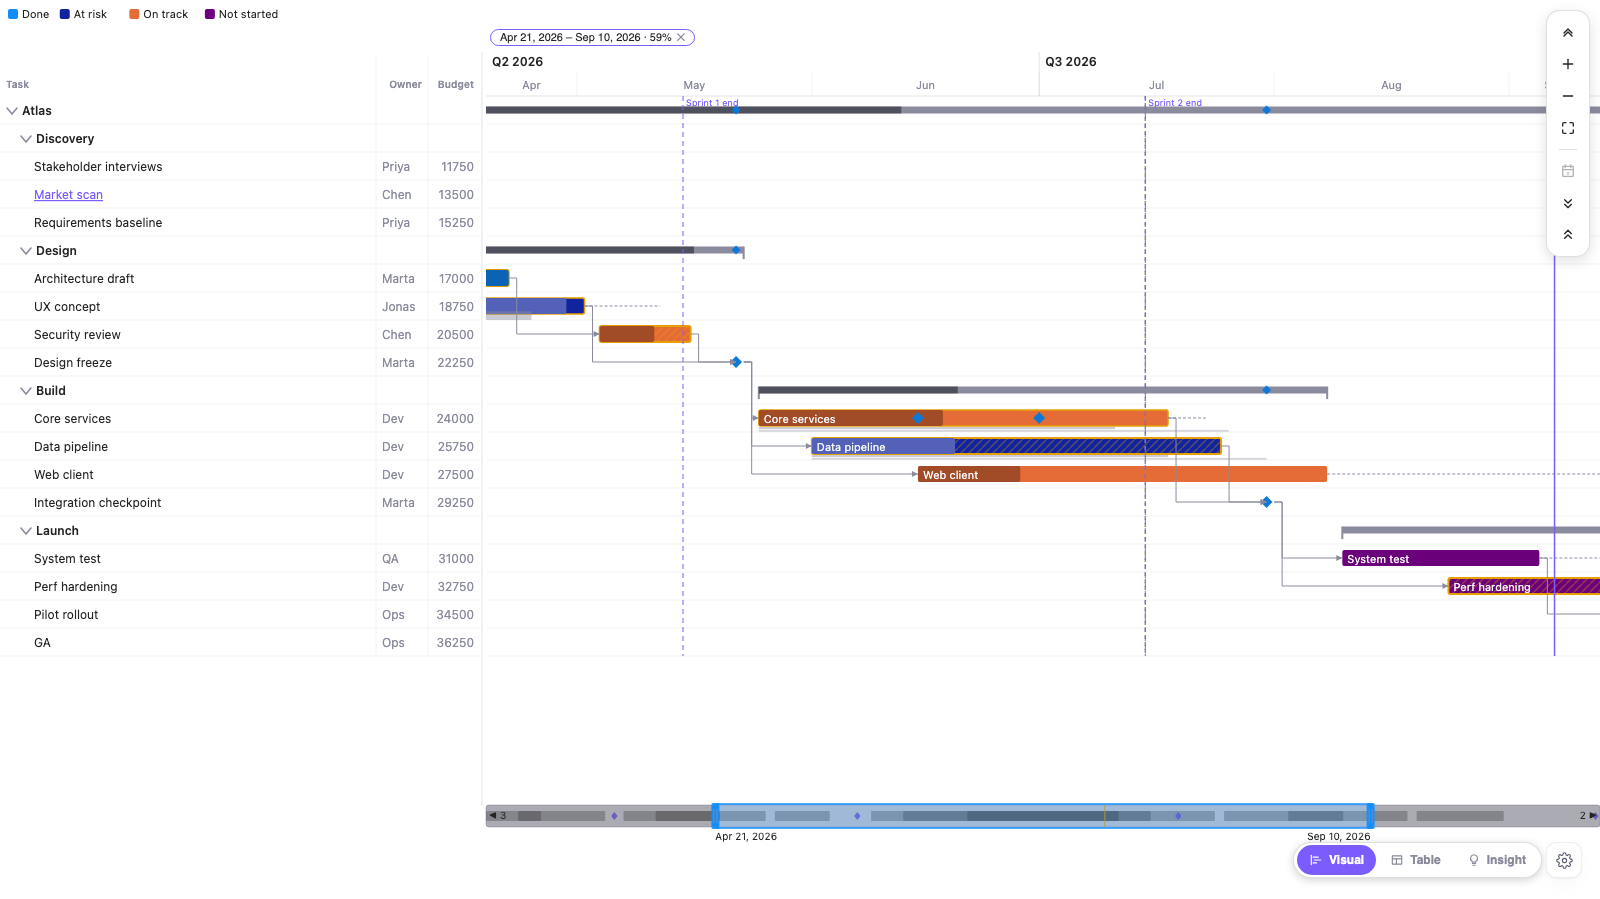
Finish-to-start, start-to-start, finish-to-finish and start-to-finish arrows read from a predecessor field, with 12FS+2d lead and lag notation and elbow routing that dodges rows. Critical path comes from a model flag when you have one, or a forward/backward CPM pass in the visual when you don't — marked with hatching, not colour alone.
Resource lanes & workload
Group the schedule into swimlanes by resource — or by any category you bind — and see where someone is booked past capacity, flagged by overlap rather than a guess. A workload histogram reads the same data underneath.
Progress insights
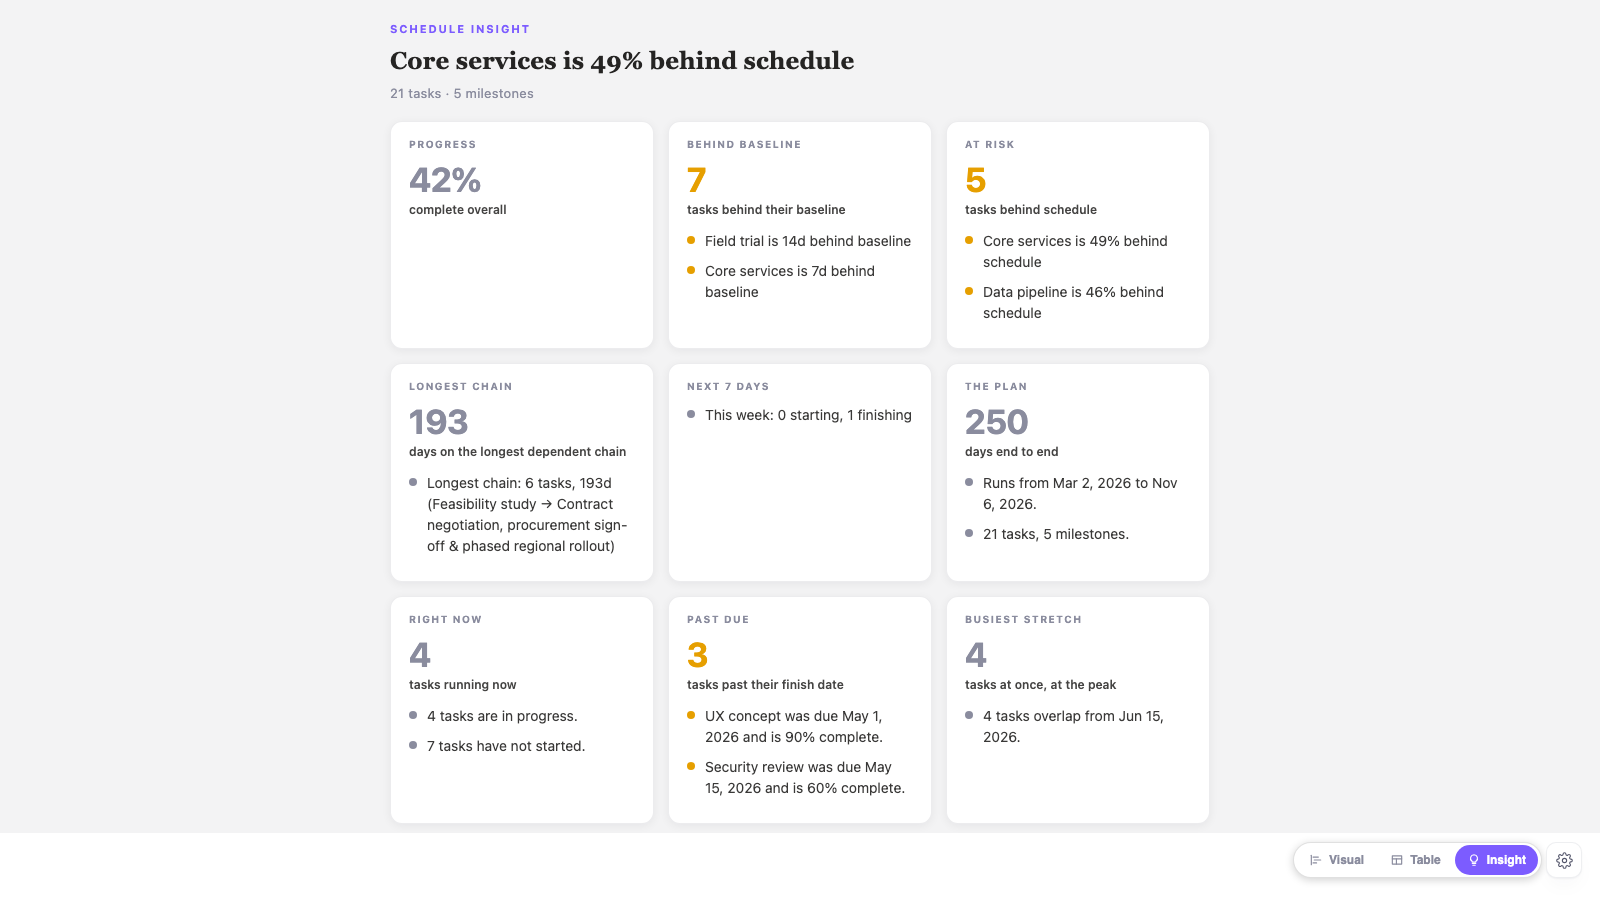
A deterministic engine anchored on your data date, not the wall clock, that names the biggest slippages, the tasks running behind where they should be by today, and the longest dependent chain — as a chip band above the timeline. No AI, no external calls.
Built for real reports
Cross-filter and multi-select, keyboard row and cell navigation with a visible focus ring, a context menu, show-as-table, and high-contrast support that replaces colour cues rather than re-tinting them. Expand state, zoom and sort persist, so bookmarks survive. Interface strings localise across about ten locales.
Screenshots
The real thing,
not a mock-up
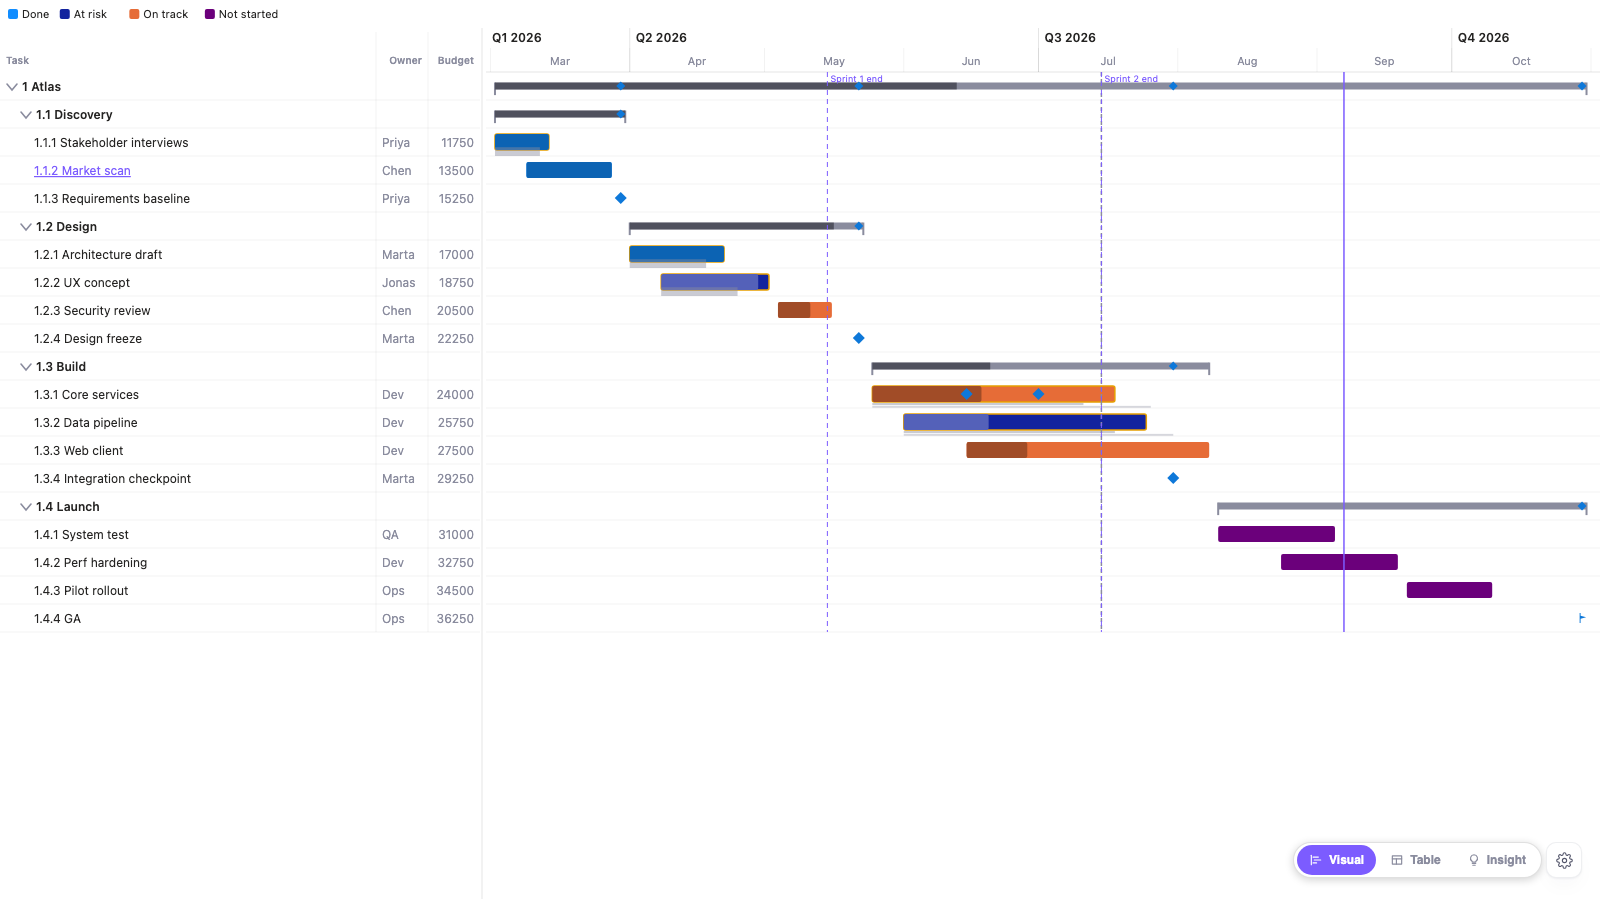
Every image below is a capture of the shipping Advanced Gantt. Where a shot needs a paid plan, its caption says so.
The Insight Engine
PaidInsights that never
leave your tenant
The Advanced Gantt computes its insights with transparent, deterministic logic — entirely inside the Power BI sandbox. No external calls, no telemetry, nothing leaves your tenant. The read-out itself is a Paid capability; the privacy promise below holds at every tier, free included.
- Biggest slippages against baseline
- Tasks running behind where they should be today
- The longest dependent chain through the schedule
- A this-week digest of what moved
Runs in the Power BI sandbox
Every insight is computed inside the Power BI visual sandbox. The visual makes no external network calls and sends no telemetry — nothing about your data leaves your tenant.
Correct before clever
Parent bars are the envelope of their children and parent progress is weighted by duration, with milestones excluded — the rollup convention project managers already expect. Critical path is a real forward/backward pass, not a heuristic.
Anchored on your data date
Progress findings are measured against the data date you bind, not the wall clock, so a report refreshed on Monday doesn't quietly rewrite what was true on Friday. Same data, same findings, every time.
Free and paid
What's free,
and what isn't
Power BI Desktop is free and fully unlocked — every feature, no task cap, no watermark, forever. You can build an entire production schedule without being asked for money. A licence starts when that report is used in the Power BI Service, and there everyone who opens it needs a seat, author and reader alike. Both paid plans unlock the identical feature set; they differ only in the per-seat rate.
Free forever — and unlimited in Desktop
500 tasks in the Service
A complete, publishable Gantt. In Power BI Desktop nothing is capped at all — every feature below and every paid one too, with no watermark and no sign-in.
- Multi-level hierarchy with WBS numbering and duration-weighted parent rollup
- Dependency arrows in all four link types, with lead and lag
- One baseline as ghost bars, under the bar or beside it
- Milestones, today and data-date lines, and the working-day calendar
- Zoom presets from years down to seconds, fiscal years and ISO weeks
- The task grid with “Use as” column promotions, search and the detail panel
- Resource lanes, the summary-table view, cross-filter, bookmarks and PDF export
$4.99/user/month or $49.90/user/year
Uncapped tasks
The whole visual in the Power BI Service. One paid tier — nothing is held back for a higher plan. One month free, run by Microsoft.
- Uncapped tasks
- Critical path and float, computed from your own schedule
- Resource analytics — overallocation, the load column and the workload histogram
- The plain-English Insight view
- Conditional rules on progress, variance or slack, with a badge and a status dot
- Earned value, the planned/earned/actual S-curve and DCMA 14-point health
- Baseline variance colouring, the variance column, and a 2nd and 3rd baseline
- The rollup KPI row, the KPI overlay band, annotations, CSV and Excel export
$3.74/user/month or $37.40/user/year
Uncapped tasks
Exactly the same product at 501 seats and up — the identical feature set at a 25% lower per-seat rate. Not a bigger tier, a bigger band.
- Everything in Pro, feature for feature — there is nothing extra to unlock
- A 25% volume rate from the 501st seat
- Sold and billed by Microsoft against your Power BI account
- One-month free trial, run by Microsoft
Everyone who opens the report needs a seat
Advanced Gantt is licensed per person in the Power BI Service, readers included. Seats are assigned to named users in your Microsoft 365 admin centre, so you buy them only for the people who actually open a report containing the visual, not for everyone employed. Building in Power BI Desktop stays free and fully unlocked, plans are sold and billed by Microsoft, and Microsoft runs a one-month free trial on both of them.
Start free
Start free, and stay free if that's enough
The free tier of the Advanced Gantt is permanent, not a trial — no watermark, no sign-in, no clock running down. Add it from AppSource, drop it on your canvas, and you're running. Everything is unlocked in Power BI Desktop; a licence applies once the report is used in the Power BI Service.
Read the getting-started docsThe free tier is staying free. If the Advanced Gantt earned its place on your report, you can support the work:
From the blog
- Power BI Gantt chart with dependencies and critical pathHow to model task dependencies for a Power BI Gantt chart (predecessor column, link types, lag), how the critical path is calculated, and when to compute it in your model.7 min read
- Power BI Gantt: parent rollups, baselines and critical pathHow summary-task dates, progress and status should roll up from child tasks, how baselines and the critical path work, and the mistakes that make a Gantt lie.6 min read