Zentrix Studio · Power BI Custom Visuals
Power BI visuals,
built like products.
We're an independent studio crafting a family of Power BI visuals — one design system, built-in insight engines, and nothing that ever leaves your tenant. Free-first, certification-ready, and documented like we mean it.
What we do
Every visual, held to
the same standard
Zentrix isn't a chart dump. It's a small, opinionated catalog where every visual shares the same design DNA, the same privacy guarantees, and the same respect for the person who has to read the dashboard.
One design system
Every visual draws from the same @zentrix token set — colors, type, spacing, motion. Drop three of our visuals on one page and they read as one product, not three plugins.
Certified by construction
No external calls, no telemetry, no eval — every visual is built to Microsoft's certification bar from the first commit, not patched up for review later.
Insight engines built in
Our visuals don't just plot. Each one reads its own pattern — streaks, anomalies, variances — with deterministic logic that runs entirely inside the Power BI sandbox.
Learn before you install
Every visual ships with a plain-English field guide and an interactive playground on this site — know exactly what every setting does before it touches your report.
The visuals
One family,
growing deliberately
Calendar Heatmap
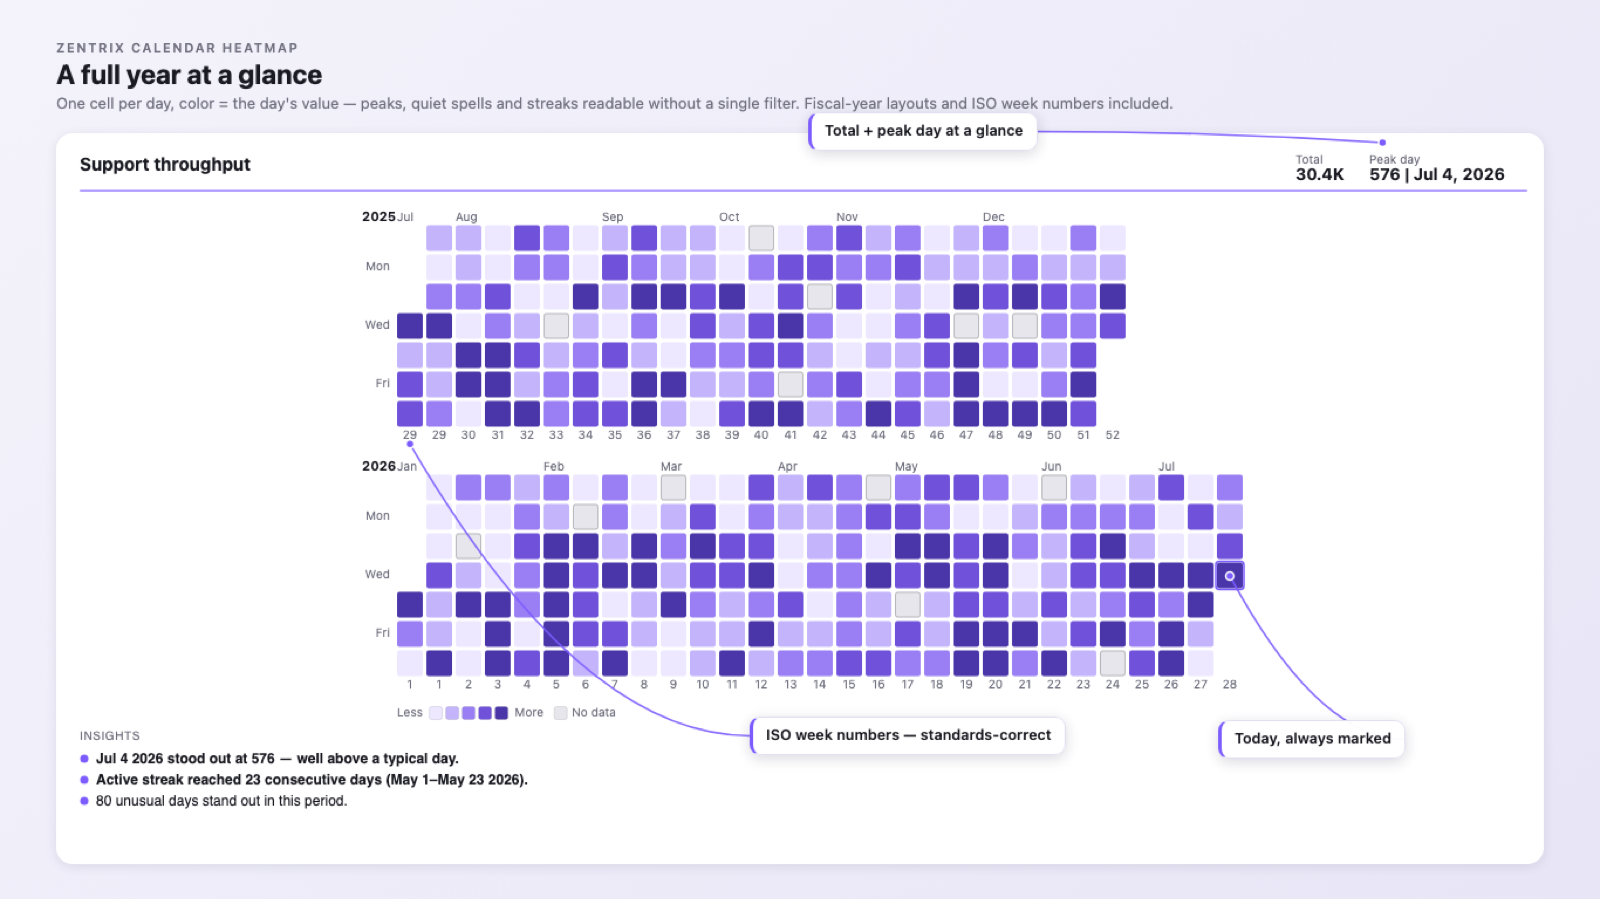
A GitHub-style full-year heatmap for Power BI with a built-in, in-sandbox insight engine. Streaks, weekday rhythm, anomalies and year-over-year — computed entirely in-sandbox.
Bar Chart
A precision bar chart with the Zentrix design language — clean defaults, smart labels, and formatting that respects your report theme.
Bullet Chart
Actual vs. target vs. bands in the compact form KPI scorecards need — the classic Few design, done properly for Power BI.
KPI Card
Headline numbers with sparkline context, variance coloring and the same token system as every other Zentrix visual.
Built in public, shipped when they meet the bar. Follow the build →
The Difference
Insight engines that
never leave your tenant
Most visuals just plot. Zentrix visuals read the pattern for you — and every computation happens inside the Power BI sandbox. No external network calls. No telemetry. Nothing about your data ever leaves your tenant — by construction, in every visual we ship.
- Active and longest streaks
- Weekday rhythm (which days run hot or cold)
- Anomalies — days that break the pattern
- Year-over-year shifts
Runs in the Power BI sandbox
Every insight is computed inside the Power BI visual sandbox. The visual makes no external network calls and sends no telemetry — nothing about your data leaves your tenant.
Deterministic insights
No AI guesswork. Streaks, weekday rhythm, anomalies, and year-over-year are computed with transparent, repeatable logic — the same data always yields the same result.
Insight engine, built in
The heatmap doesn't just plot — it reads the pattern for you, surfacing what changed and what's worth a second look, right on the canvas.
Built in public
Live on Microsoft AppSource
The Calendar Heatmap, the Network Graph and Sankey Pro are all live on Microsoft AppSource, with more of the family being built and submitted in the open. We'll add real install counts and ratings here as they grow — no placeholder numbers until then.
Pricing
Free first
Every Zentrix visual ships with a genuinely useful free core — no trial, no watermark, no sign-in. Where a visual has paid tiers, they buy analysis and scale, never the basics. How readers are licensed differs per visual, and the pricing page says which is which.
$0
Permanent, not a trial. The Calendar Heatmap is fully unlocked today.
- The complete core visual
- Runs entirely in-sandbox
- No sign-in, no watermark
- Everything unlocked in Power BI Desktop
from $1.49
Per user, per month. All three live on AppSource today.
- Network Graph — free to 500 nodes, then Pro from $2.49 and Enterprise from $5.49 per report author
- Network Graph readers are always free
- Sankey Pro — free and uncapped in Power BI Desktop, from $1.49 per user in the service
- Financial Chart — free and fully unlocked in Power BI Desktop, from $1.99 per user in the service
- Billed by Microsoft, no separate account
The free tiers are staying free — if a visual saved you time, you canSupport me on Ko-fi
Get started
Put Zentrix visuals
on your dashboard
Start with the Calendar Heatmap — free, fast to add, and built to keep your data inside your tenant. The rest of the family is on its way.
Need a custom visual? Talk to us →