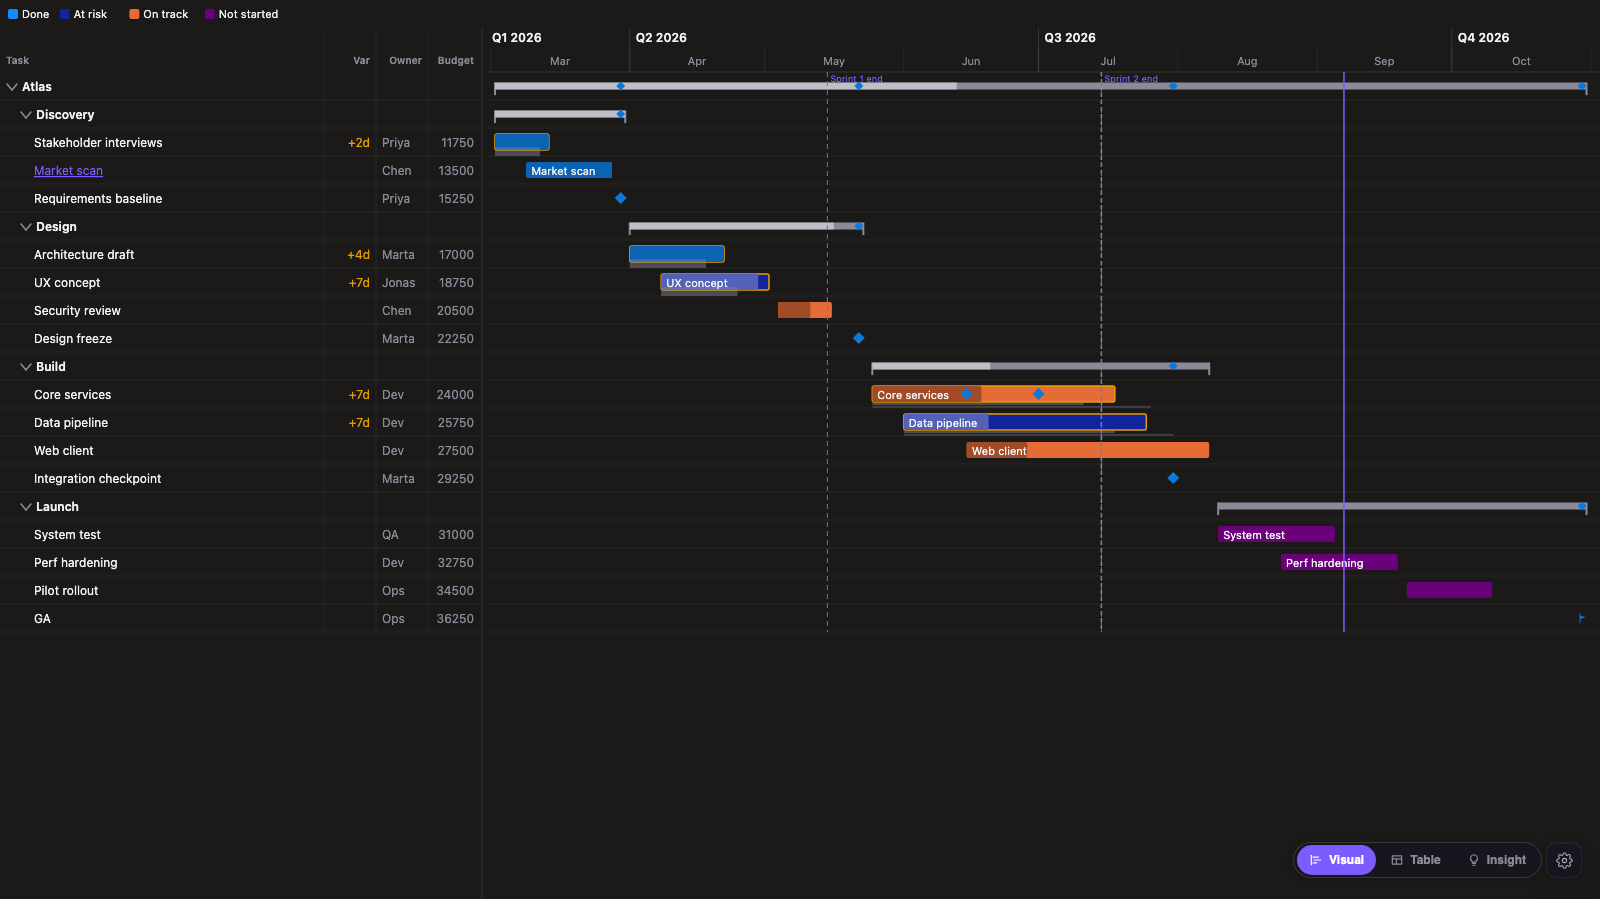
If a report looks fine in the browser but the PDF export is greyed out, the PowerPoint deck has a gap, or the subscription email shows an error symbol where a chart should be, the cause is usually one specific visual. Often it's a custom visual that isn't certified. That isn't the only possible cause, though, so here's how to narrow it down.
Why custom visuals behave differently in exports
Export to PDF, export to PowerPoint and email subscriptions all turn the live report into a static copy. A custom visual is third-party code, and Microsoft only supports it in those copies if it has passed certification, a code review and set of tests by the Power BI team. Subscriptions are a Power BI Service feature (the Service is the online app where reports get shared), and PDF export works from both the Service and Power BI Desktop.
Microsoft's docs are direct about it. The PDF export page lists Power BI custom visuals as unsupported, with "the exception" of certified ones, and says that in that case the PDF option is greyed out or not listed on the Export menu. The subscription page says custom visuals that aren't certified display an error symbol in the email. The PowerPoint export page has the same certified-only exception.
There's a technical reason as well. A certified visual has to implement Power BI's rendering events, which is how it tells the export service "I've started drawing" and "I'm done". Without that signal the service has no way of knowing when the snapshot is safe to take. Microsoft's developer docs say any visual that exports to PowerPoint or PDF must contain rendering events so the export doesn't start before the visual has finished.
A checklist, in the order I'd check it
1. Is the visual certified?
Click the visual, and in the Visualizations pane right-click its icon and choose About, or look it up on AppSource (Microsoft's store for add-ons). A certified visual has a yellow "PBI Certified" badge on its AppSource page. Inside Power BI, the store has a Power BI Certified filter. Microsoft says a newly approved visual's badge can take up to three weeks to appear, so if the vendor says it's certified and you can't see a badge, ask them.
If it isn't certified, that's your answer. No setting on your side will make an uncertified custom visual render in a PDF or a subscription.
2. Was it imported from a file instead of AppSource?
Certification belongs to the version on AppSource. If someone on your team imported a .pbiviz file they downloaded, or an older copy that's been sitting in the report, the report may not be using the certified version. Replacing it with the AppSource version (from Get more visuals inside Power BI) is the first thing I'd try. Microsoft's admin docs describe this swap for organisational visuals too: add the AppSource version, then select the old visual on the canvas and pick the AppSource one to replace it.
3. Is it something else on the page?
Custom visuals aren't the only thing exports skip. Microsoft's PDF page also lists ESRI ArcGIS maps, Power Apps visuals, Power Automate visuals, the paginated report visual, Visio visuals and the Copilot narrative visual as unsupported, and says a visual shown as a data point table can't be exported. The subscription page has a similar list. If the error symbol is on one of these, certification of your custom visual isn't the problem.
4. Is the report itself too big, or blocked by a setting?
- PDF export doesn't work for reports with more than 50 pages or larger than 250 MB.
- Subscription attachments (a full report as a PDF or PowerPoint, which needs a Premium or Premium Per User workspace) are limited to 20 pages and under 25 MB.
- Both export and subscriptions fail when the admin setting Azure private link with Block public internet access is on.
- An admin can switch export off entirely. If you don't see the Export option at all, check you're on a report (not a dashboard) and ask your Fabric administrator (the person who runs Power BI settings for your organisation).
5. Does the visual render in the browser at all?
If it fails in the browser too, it's a different problem. One cause worth knowing: an admin setting called Add and use certified visuals only. When it's on, only certified visuals render in the organisation's reports, and uncertified ones from AppSource or a file return an error. Visuals the admin has added to the organisation's own visual list (the organisational store) are exempt.
What the export will look like when it works
Even with a certified visual, an export is a snapshot, not the live report. A few things from Microsoft's PDF page that surprise people:
- Pages export at 1,280 x 720 pixels.
- Visuals with scrollbars export in their default, unscrolled state.
- Visuals you've drilled into export in their default state.
- Hidden pages aren't included in exports and subscriptions.
- Custom fonts in a theme are replaced by a default font.
For long visuals like a Gantt chart or a big table, the scrollbar rule matters most: the export shows the top of the list, not where you'd scrolled to. If the visual has a "fit all rows" or similar option, turn it on in a copy of the page meant for export.
If the visual isn't certified and you can't change it
You have three realistic options. Ask the vendor whether certification is planned. Swap to a certified visual that does the same job; the certified filter in Get more visuals is the quickest way to see what's available. Or, if nothing on the store fits and the export matters to the business, have a visual built that's certifiable from the start. I've written about what goes into building one, and about what certification checks in more detail.
For what it's worth, four of our visuals are certified (Zentrix Network Graph, Zentrix Sankey Pro, Zentrix Advanced Gantt and Zentrix Calendar Heatmap), so the export rules above apply to them the same way they apply to any other certified visual. The visuals page lists them with their marketplace links.