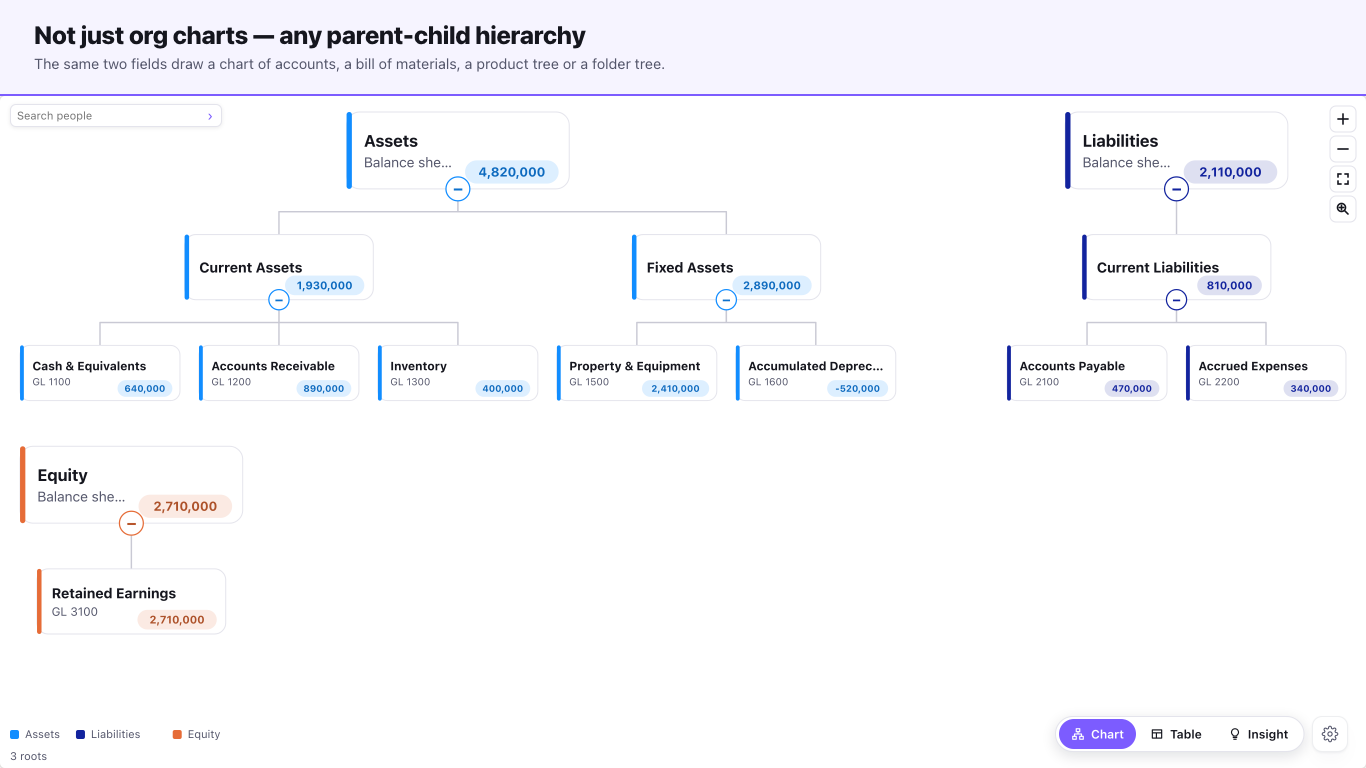
A Power BI custom visual is a small web app that runs inside a Power BI report. It's written in TypeScript, packaged as a single .pbiviz file, and from then on behaves like any other visual on the canvas: you drag fields onto it, it cross-filters, it respects slicers. I build these for a living, so this is the practical version of what goes into one, and what I'd ask any developer (including me) before paying for one.
When a custom visual is worth it
Microsoft's own docs put it simply: if none of the built-in visuals or the ones on AppSource (Microsoft's store for add-ons) meet your needs, you can create your own, for yourself, your organisation or everyone. In practice that comes down to a few situations:
- The chart type doesn't exist in Power BI. There's no Gantt chart or candlestick chart among the built-in visuals, for example. Some gaps are covered by marketplace visuals, some aren't.
- A marketplace visual is close but not right for your data shape, your interaction, or your brand, and the vendor won't change it for you.
- Your reports go out as PDFs, PowerPoint decks or email subscriptions, and the visual you use isn't certified, so it doesn't show up there. More on that below.
- IT won't approve an outside visual and you need one you own and can hand to the security team.
If a core visual or a well-reviewed marketplace visual gets you most of the way, use that. A custom build is software someone has to maintain.
What the work actually involves
Setup and tooling
The toolchain is Node.js plus the pbiviz command-line tool (npm i -g powerbi-visuals-tools@latest). Microsoft's prerequisites also include a Power BI Pro or Premium Per User account, and you switch on developer mode in Power BI Desktop or the Service (the online app where reports get shared) so you can load a visual that's still in development. None of that is hard. The next parts take the time.
Data roles: deciding what the report author drags in
Every visual has a capabilities.json file. It declares the field wells the report author sees (Category, Values, Start date and so on), how Power BI should shape the data it hands over, and every formatting option in the Format pane. This file is where most of my design time goes, because it's the contract with the person building the report. Get it wrong and the visual is awkward to use no matter how good it looks.
It also has rules that aren't obvious until something breaks. One example from Microsoft's drill-down docs: the data role you enable drill-down on must be a grouping role with max set to 1. Declare it differently and the host's drill buttons simply don't work. I've made that mistake once, which is why our visuals now have an automated test that checks every declared capability against the Microsoft page it came from.
Rendering and the update loop
Power BI calls the visual's update method whenever something changes: new data, a resize, a filter, a slicer, a selection in another visual, a bookmark. The visual has to redraw correctly for every one of those, from an empty dataset to a large one, in Desktop and in the Service. Most of the bugs live here, so most of the testing does too.
Certification-safe code from day one
If you want the visual to be certified later (and for most business use you do), the code has to follow Microsoft's rules from the start. A certified visual can't make HTTP or WebSocket requests, can't use eval, can't put user data into the page with innerHTML, and must not throw errors in the console for any input. It must also call the rendering events API (renderingStarted, renderingFinished, renderingFailed), which is how PDF and PowerPoint export know the visual has finished drawing. Retrofitting all of that onto a visual that wasn't built for it is slow, so I treat it as a requirement, not a later step.
Two related things that catch people. "No external calls" doesn't mean "declare no privileges": if the visual offers its own CSV or Excel export through Power BI's file download API, it has to declare that privilege in capabilities.json, and an admin setting called Allow downloads from custom visuals controls whether it's allowed at all. And the review needs the source code, which doesn't have to be public but has to match the package you submitted.
How the visual gets to your users
| Route | What it is | Good for |
|---|---|---|
| Import from file | Someone imports the .pbiviz into a report | Testing, a single team |
| Organisational store | A Fabric administrator (the person who runs Power BI settings for the company) adds it to the organisation's visual list | Internal visuals you don't want public |
| AppSource | Published through Microsoft Partner Center, optionally certified | Visuals meant for anyone |
The organisational store is the usual home for a company-specific visual. Microsoft's admin docs say an admin can add any visual there, including uncertified ones and .pbiviz files, even if they contradict the organisation's tenant settings. Updating it means the admin uploads the new file over the old one.
AppSource has a fixed checklist: the .pbiviz package, a sample .pbix report that works offline, a 300 x 300 logo, between one and five screenshots at exactly 1366 x 768, plus support, privacy and licence links. Certification is a separate box you tick in Partner Center, and Microsoft recommends publishing first because certification can take time.
One rule that cost us a resubmission: every package you upload has to have a higher version number than the last one you submitted, even if the earlier one was rejected and never published. Microsoft's Partner Center page says the GUID must stay the same and the version should go up, and the sample report must use the same version of the visual as the package.
Certified or not: it changes where the visual works
This is the part I'd want a client to understand before scoping anything. Microsoft's PDF export page lists custom visuals as unsupported, with the exception of certified ones, and the email subscription page says uncertified custom visuals show an error symbol. An admin can also switch on Add and use certified visuals only, after which uncertified visuals from AppSource or a file return an error (visuals in the organisational store are exempt). I wrote up the details in what Microsoft certification means for a Power BI visual.
So if the visual will live in the organisational store and nobody exports or subscribes to the report, certification may not matter. If reports go out as PDFs or emails, it does, and that affects how the code has to be written.
What to ask before you hire someone
- Will the code be certifiable? No network calls, no
eval, rendering events in place. Ask how they check it. - How do they test it? Ask what happens with empty data, nulls, very long labels, thousands of rows, a dark report theme, and high-contrast mode.
- Does it behave like a native visual? Cross-filtering, cross-highlighting, tooltips, bookmarks, keyboard navigation.
- Who owns the source, and who updates it when Power BI's API changes?
- How will it be distributed: file, organisational store, or AppSource?
- Can they show you a shipped visual you can install and try?
How I work on these
For our own visuals and for custom work I follow the same order: a short discovery about who uses the report, the shape of the data and how it'll be deployed; a written spec of the data roles, interactions and acceptance criteria; the design for the report canvas, including accessibility; then development with the Power BI visuals SDK in TypeScript and D3, validation for performance and host compatibility, and packaging for either private distribution or AppSource. Timelines depend on how many data roles, interactions and formatting options the visual needs, so I confirm them after discovery rather than quoting a generic date.
If you want to see what that produces, our published visuals are free to try in Power BI Desktop. If you have a report that needs something Power BI can't draw, the contact page has a "build a custom visual" option, and a short description of the data and the problem is enough to start.